
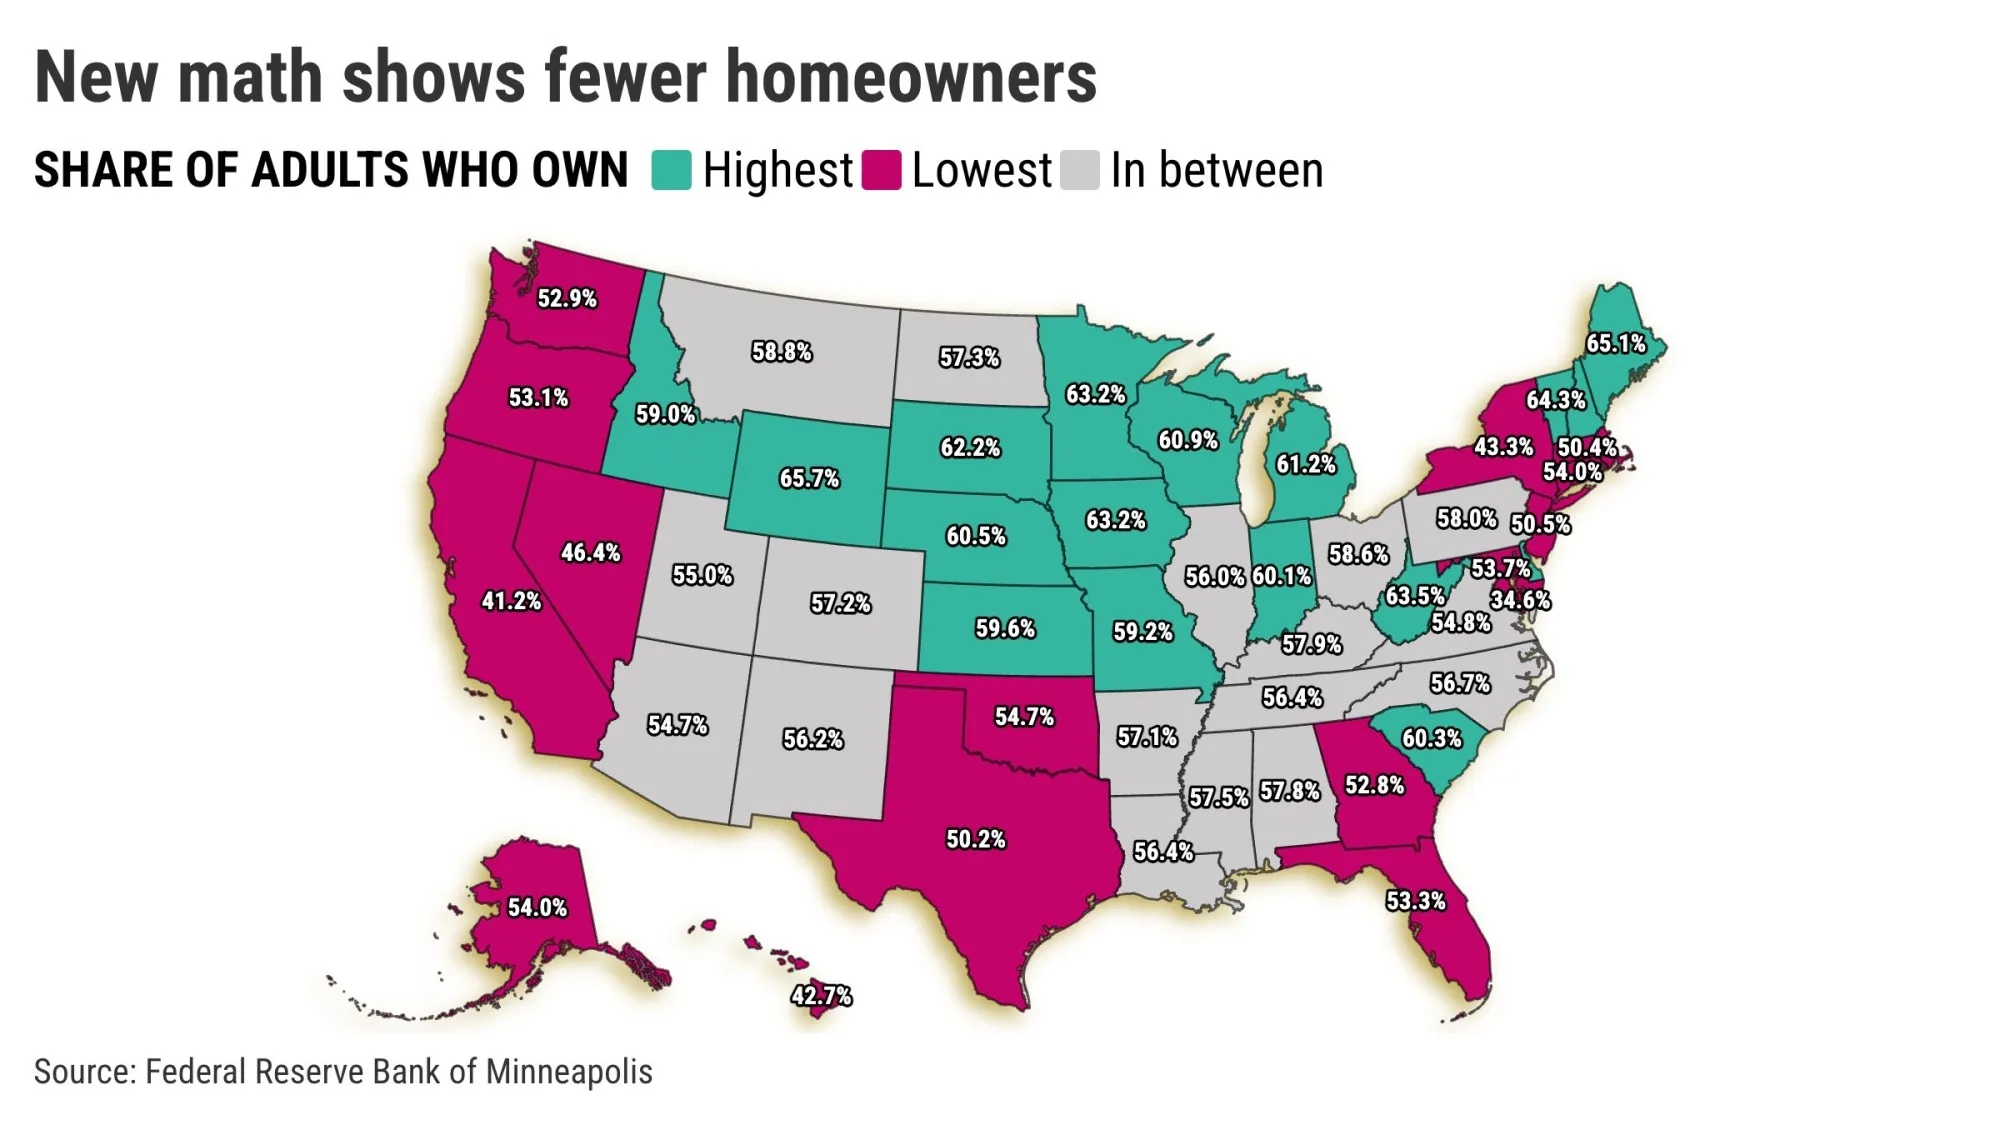
New numbers from economists at the Federal Reserve Bank of Minneapolis suggest far fewer Californians – and Americans, too – own a home.
Read more Tustin to take offers for future of historic south hangar
The recalculation of ownership is more tied to the people who are tracked than any key economic factors.
Start with the traditional number from the Census Bureau. It tells us the share of households living in a home they own. Group housing – think college dorms or senior living arrangements – isn’t counted.
However, the Minneapolis Fed’s number looks at adults living in households as well as those group settings. So the non-owner count grows to include people such as young adults still living at home, folks who rent a room or those in group-living sites.
Sadly, no matter the statistical efforts, here’s what the new math confirms for the umpteenth time: It’s terribly difficult to be a California homeowner.
My trusty spreadsheet‘s peek at the Minneapolis Fed’s math found 41% of Californians were homeowners last year. That’s the second-lowest percentage among the states and well below the nation’s 53%. Only the District of Columbia was lower, at 35%.
Now, where do the most people own their residences, according to the Minneapolis Fed? Wyoming at 66%, Maine at 65% and Vermont at 64%.
These new numbers aren’t very kind to California’s economic arch-rivals, either.
Texas has 50% of residents who own, which is the sixth-lowest rate. And Florida’s 53% share was the 13th lowest.
Old school thinking
Let’s review the old numbers from the Census Bureau. These figures weren’t friendly to the Golden State either.
Census stats say California’s 56% share of households that owned their home in 2025. That ranked third-lowest among the states. Only D.C. at 41% and New York at 54% were lower.
The nation comes in at 65%, with the highest ownership in West Virginia at 76% and in Delaware and Vermont at 74%.
And the rivals? Texas at 62% ranked eighth-lowest, while Florida’s 68% ranked 24th-best.
Mind the gap
So what does the gap between the new and the traditional yardsticks tell us about the nation?
Read more Canada is ready to celebrate new bridge to US amid tariff troubles with Trump
Ponder how these two ownership metrics compare when they’re measured against slices of state rankings using other economic factors.
Let’s start with how old a state’s population is. The 17 oldest states have a median age of 42 vs. 39 for the 17 youngest.
The traditional census numbers show a median ownership level of 69% in the oldest states vs. 67% in the youngest ones.
There’s a slightly narrower difference in the Minneapolis Fed’s math: 58% ownership in the oldest states vs. 57% in the youngest.
It’s simply more confirmation that ownership is largely an older folks’ game.
Next, eyeball the share of young adults living at home with their parents. The 17 states with the most have 36% at home vs. 25% in 17 states where it’s less common.
Ownership runs 67% where kids were most likely to be at home, by the traditional census stats, a smidgen below 68% where this trend is rare.
But there’s a decided difference in the Minneapolis Fed math. The median ownership is just 53% when kids-at-home is highest vs. 59% when it is lowest.
This is a living arrangement often tied to financial pressures on young adults. Because no matter how you slice it, costs limit ownership.
Contemplate one measure of homebuying affordability, a payment-to-income ratio. The 17 most affordable states see typical house payments run at 86% of incomes, vs. 55% in the 17 states where homebuying is a huge financial stretch.
Both ownership metrics tell a depressing tale.
Census stats show the most affordable states with higher median ownership, 68% to 64%. Meanwhile, the Minneapolis Fed’s new math shows 58% ownership where affordability’s best vs. 53% where it was worst.
Jonathan Lansner is the business columnist for the Southern California News Group. He can be reached at [email protected]
Read more Democrats to finalize their 2028 presidential nominating calendar, led by more diverse states
- Try Jonathan Lansner’s Substack collection of economic trends. CLICK HERE!