
Untethered from either of the two major political parties, independents are one of California’s fastest-growing voting blocs.
Read more FBI raids share threads with investigations into Chinese influence in Southern California
And while they are far from a monolith, independents are also not synonymous with moderates, election experts and polling data show.
That makes figuring out just who these voters are who have bucked a party label — what drives them to cast a ballot, if they vote at all — both a puzzle and a prize for campaigns heading into the midterm elections this fall.
First, that means figuring out why Californians chose either a third party or no party at all when registering to vote.
And that might come down to trust, said Jorge Flores, a Los Angeles-based public affairs consultant and veteran campaign strategist.
“Who is actually going to look out for the issues I care about and be there when I need them, as opposed to an affiliate of a particular party who follows the party line and party leadership,” Flores said. “There’s an element of: Who can I trust to look after me and my family?”
Independent voters are diverse by their very definition, said Chad Peace, chief legal strategist for the Independent Voter Project, a group that aims to engage nonpartisan voters and backed California’s move to the jungle primary system, where the top two vote-getters, regardless of party affiliation, advance to the general in the fall.
“Some of them are independents because the Democrats are not far left enough for them, or the Republicans are not far right enough … or because they are conservative on this social issue, but liberal on this economic issue, or vice versa,” said Peace, who is based in San Diego.
Still, most voters in California do register with one of the two major political parties.
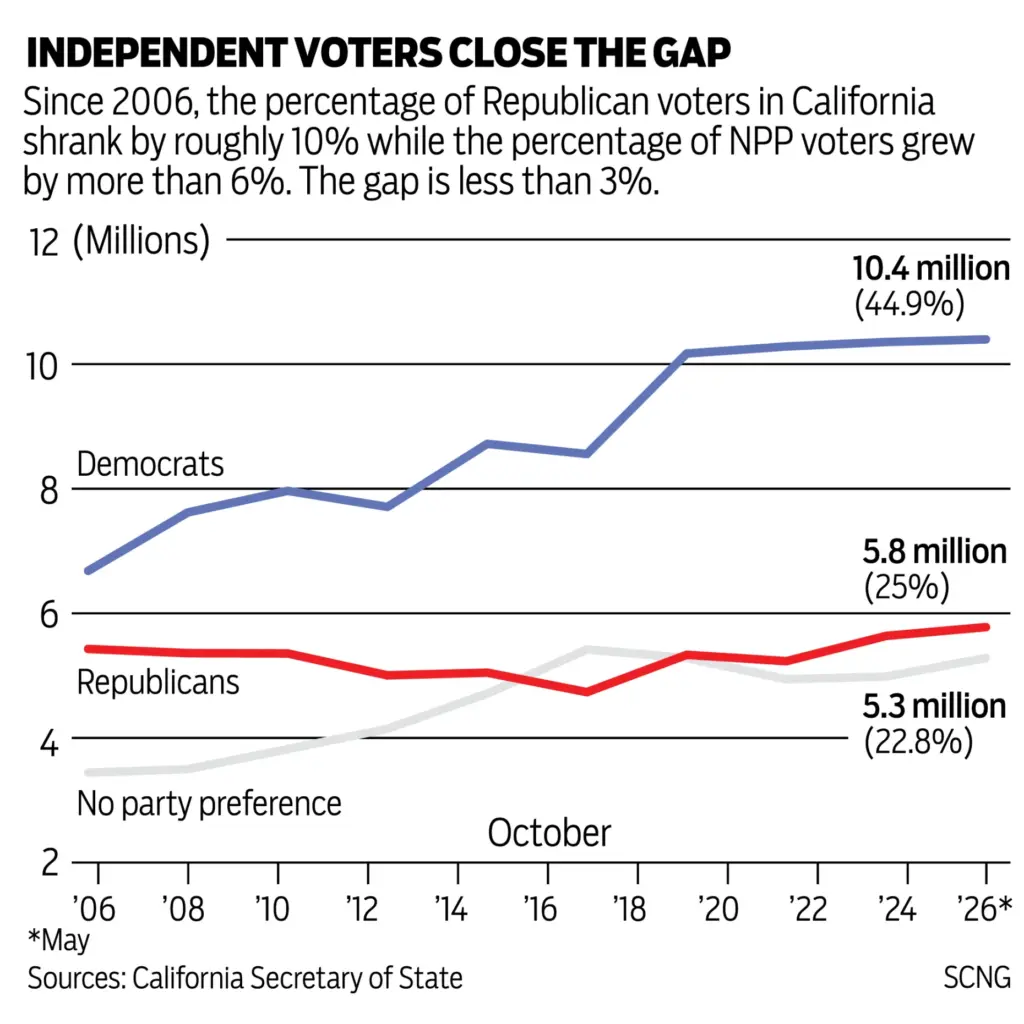
As of May, nearly 10.4 million people were registered with the Democratic Party — that’s nearly 45% of the state’s 23.2 million registered voters. Another 5.8 million people chose the Republican Party, nearly 25% of the state’s registered voters.
The 5.3 million voters who identified as no party preference — the largest contingent of independent voters — accounted for nearly 23%.
But that voting bloc has risen over the years.
Two decades ago, in October 2006, about 3 million voters identified as no party preference. Then, that was about 18.7% of the state’s registered voters.
By October 2012, a presidential election year, more than 3.8 million people, or nearly 21% of California’s registered voters, picked no party preference.
The percentage of no party preference voters peaked in 2018, at 27.5%, before dropping a bit over the next three election cycles.
But the most recent voter registration statistics from the California secretary of state show a bit of a rise again: In October 2024, only 22% of registered voters were no party preference.
Nationally, too, independent voters are on the rise.
A Gallup survey conducted last year found 45% of U.S. adults identified as independents, while 27% each picked Democrat or Republican. That finding was a record high for independents, Gallup said in its report.
It’s younger voters who are largely contributing to this trend of independent voters, studies have shown.
That national Gallup survey found majorities of Gen Z (born between 1997-2007) and millennial (born between 1981-1996) voters were independents.
Comparatively, fewer than one-third of the Silent Generation (born before 1946) voters identified as independent, and about one-third of baby boomers (born between 1946-1964) identified as such.
Locally, there have been similar findings.
A recent survey conducted by the UC Irvine School of Social Ecology found nearly half of Gen Z residents in Orange County identified as independents, as did 42% of millennials.
Overall, though, 34% of respondents said they were independents, on par with another 34% who said they identify as Democrats. Republicans weren’t far behind, with 32% of the poll’s respondents picking the GOP.
Voter registration statistics show a little more distance.
Of the nearly 2 million registered voters in Orange County, 36.4% (or nearly 695,000 people) are Democrats, and 33.8% of the county’s voters (about 644,00 people) are Republicans.
That leaves 23.4% (446,500 people) of the county’s voters registered as no party preference, with the rest of the electorate picking the American Independent, Green, Libertarian or Peace and Freedom parties, or “other” or “unknown” for party registration, according to the secretary of state’s figures.
The UCI polling found “this huge generational difference in terms of how people identify themselves, how they see the world and whether they are going to vote,” said Jon Gould, poll director and dean of the School of Social Ecology.
“Nationally, when we do polling, we have found that young people generally identify with the Democratic Party. And here, our youngest voters, Gen Z and millennials, are much more likely to identify as an independent than anything else,” Gould said.
“But that doesn’t mean they are moderates,” he added.
Voters, Gould said, are upset with political leadership, whether that’s Republican President Donald Trump at the national level or Democratic Gov. Gavin Newsom as the state’s chief executive.
These voters are moving to no party preference or independent, rather than a political party, “because there’s kind of a sense of a pox on both parties’ houses,” Gould said.
Flores expressed a similar sentiment from his experience talking to voters this primary election in California’s 40th Congressional District, which spans Orange and Riverside counties. There, he was advising independent candidate Nina Linh, who lost in the primary.
“The voters we talked to that were independents were distressed in the institutions,” Flores said. “Neither party was able to deliver for them, provide basic services or look out for the common needs that voters are looking for.”
“They felt that no one had their interests, in terms of housing affordability, in terms of maintaining and improving infrastructure and roads and such. They didn’t have any trust that anyone had any interest for their kitchen table issues because they were so bogged down on the extremes, both parties.”
The test, then, is getting independent voters to cast ballots in the fall.
UCI’s study found only 45% of Gen Z residents in Orange County are certain to vote, while 87% of boomers are.
That’s not surprising, said Gould, if they are feeling particularly let down by their political leaders or the two major parties in general.
“We really have a disillusioned group of younger residents here, and that’s tinder for potential proverbial fires in a community, and that’s tinder for political fires across the country,” Gould said.
“If there is a candidate or party that can tap into that, they’re going to have young people coming out for them,” he said.
In the 2024 election, nearly 600,000 no party preference voters — 57% of that voting bloc – participated. In comparison, 73.2% of registered Democrats cast a ballot in that election, as did 79% of Republicans.
In 2018, when there was a spike of registered no party preference voters, 58.6% of this contingent turned out in the general election. That was along with 74.5% of registered Republicans and 73.4% of Democrats.
(The California secretary of state does not yet have these turnout figures from the June primary. That data is expected to be released in December, according to the office.)
Still, Peace said independent voters want to — and should — participate in elections and effectuate change.
“The question that we ask is: Where does my fundamental right to vote derive?” he said. “Does it derive as being a citizen or does it derive at the moment I join a political party?”
Read more Cut the number of choices you make each day. Your brain will thank you