
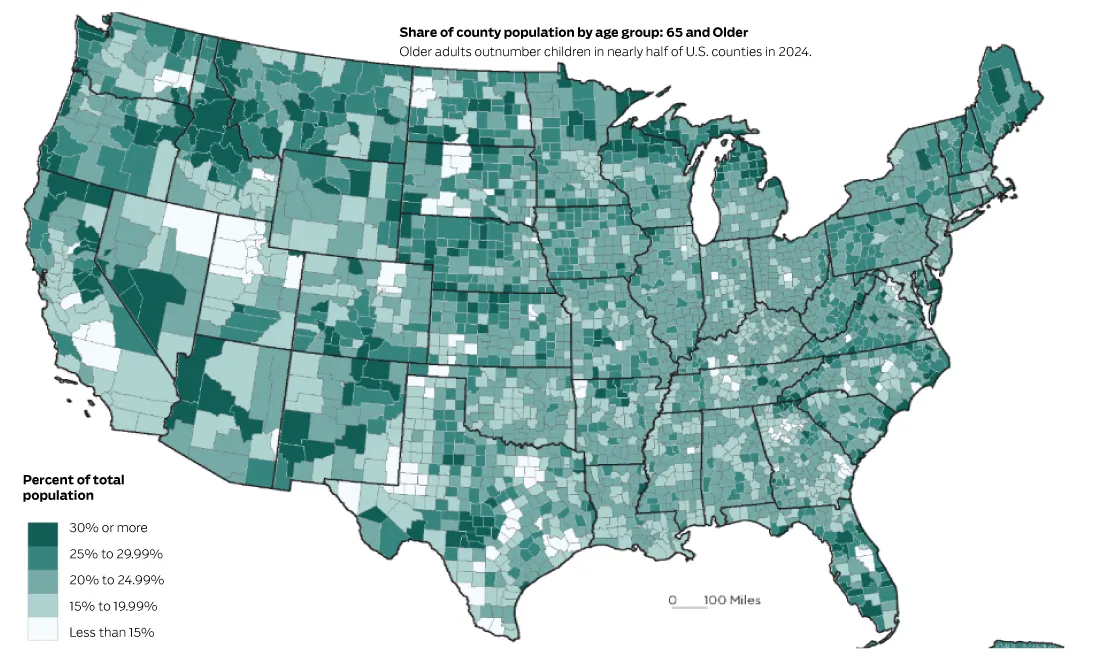
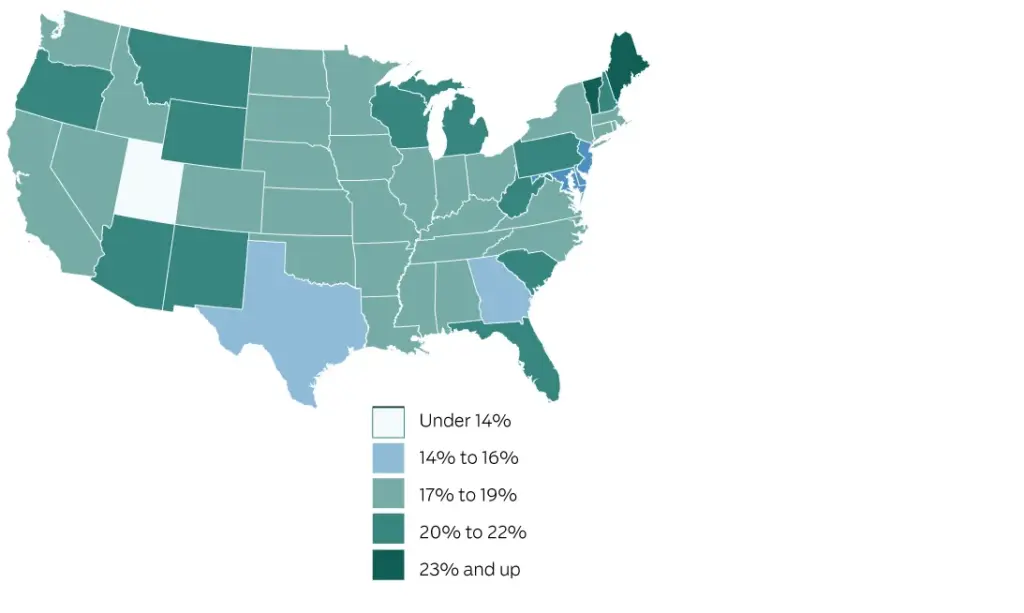
America’s population is aging, but the trend looks very different from one state to the next.
Read more Justice Department drops criminal case against ex-Olympian charged with damaging Reflecting Pool
The number of Americans ages 65 and older is projected to increase from 58 million in 2022 to 82 million by 2050 (a 42% increase), and the 65-and-older age group’s share of the total population is projected to rise from 17% to 23%.
The current growth of the population ages 65 and older, driven by the large baby boom generation—those born between 1946 and 1964—is unprecedented in U.S. history.
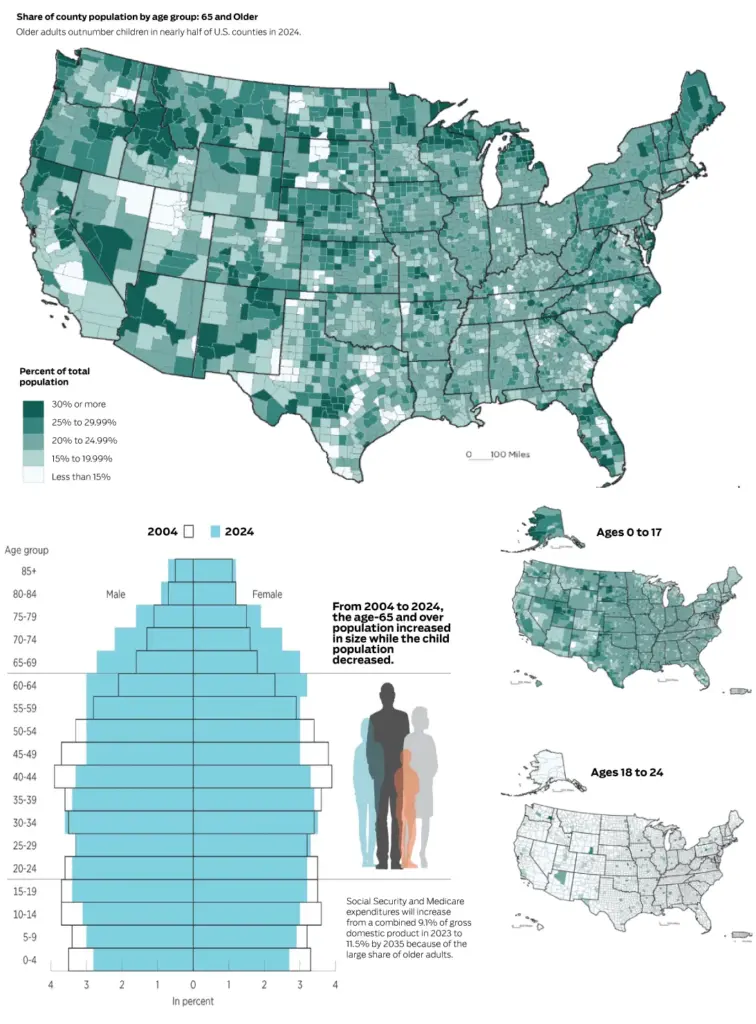
From 2004 to 2024, the age 65-and-over population increased in size while the child population decreased.
Older adults outnumber children in nearly half of U.S. counties in 2024.
This aging of the U.S. population has brought both challenges and opportunities to the economy, infrastructure and institutions.
Social Security and Medicare expenditures will increase from a combined 9.1% of gross domestic product in 2023 to 11.5% by 2035 because of the large share of older adults.
Read more Santa Anita Park re-opens after $18 million modernization
The U.S. population is older today than it has ever been. Between 1980 and 2022, the median age of the population increased from 30.0 to 38.9, but one-third of states in the country had a median age above 40 in 2022, with Maine (44.8) and New Hampshire (43.3) at the top of the list.
The older population is becoming more racially and ethnically diverse. Between 2022 and 2050 the share of the older population that identifies as non-Hispanic white is projected to drop from 75% to 60%.
Older adults are working longer. By 2022, 24% of men and about 15% of women ages 65 and older were in the labor force. These levels are projected to rise further by 2032, to 25% for men and 17% for women.
The poverty rate for Americans ages 65 and older has dropped sharply during the past 50 years, from nearly 30% in 1966 to 10% today. The Census Bureau’s Supplemental Poverty Measure, which accounts for non-cash benefits, tax credits and medical expenses, shows that 14% of older Americans lived in poverty in 2022.
State share of population
State | % aged 65+ | Total
- Maine | 23.5% | 330,000
- Vermont | 22.9% | 148,000
- West Virginia | 21.9% | 387,000
- Florida | 21.8% | 5.1 million
- Delaware | 21.7% | 228,000
- Hawaii | 21.5% | 311,000
- New Hampshire | 21.5% | 303,000
- Montana | 21.2% | 241,000
- Pennsylvania | 20.4% | 2.7 million
- New Mexico | 20.1% | 429,000
- Wyoming | 20.0% | 117,000
- Oregon | 19.9% | 850,000
- South Carolina | 19.8% | 1.1 million
- Rhode Island | 19.8% | 220,000
- Arizona | 19.7% | 1.5 million
- Michigan | 19.6% | 2 million
- Wisconsin | 19.6% | 1.2 million
- Connecticut | 19.4% | 713,000
- Ohio | 19.1% | 2.3 million
- South Dakota | 19.0% | 176,000
- New York | 18.9% | 3.8 million
- Iowa | 18.9% | 613,000
- Massachusetts | 18.7% | 1.3 million
- Missouri | 18.7% | 1.2 million
- Alabama | 18.5% | 955,000
- Minnesota | 18.2% | 1.1 million
- Arkansas | 18.2% | 563,000
- Mississippi | 18.1% | 531,000
- New Jersey | 18.0% | 1.7 million
- Kentucky | 18.0% | 826,000
- Kansas | 18.0% | 534,000
- Illinois | 17.9% | 2.3 million
- North Carolina | 17.9% | 2.0 million
- Louisiana | 17.8% | 820,000
- Idaho | 17.8% | 356,000
- Virginia | 17.6% | 1.6 million
- Tennessee | 17.6% | 1.3 million
- Indiana | 17.6% | 1.2 million
- Maryland | 17.6% | 1.1 million
- Nevada | 17.6% | 575,000
- North Dakota | 17.6% | 140,000
- Nebraska | 17.4% | 348,000
- Washington | 17.3% | 1.4 million
- Oklahoma | 16.9% | 692,000
- California | 16.5% | 6.5 million
- Colorado | 16.5% | 980,000
- Georgia | 15.8% | 1.8 million
- Alaska | 14.8% | 109,000
- Texas | 14.0% | 4.4 million
- DC | 12.9% | 91,000
- Utah | 12.4% | 435,000
U.S. Average | 17.7% | 61.2 million
Sources: U.S. Census, PRB analysis,U.S. Bureau of Labor Statistics, U.S. Centers for Disease Control and Prevention
Read more Dangerous heat expected across Southern California through weekend