
If California wants to grow its population, and I’m often not sure about that, growing the supply of single-family housing might help.
Read more Immigration crackdown threatens Haitian caregivers and the seniors who rely on them
My trusty spreadsheet helped me see this wisdom by deciphering demographic, real estate and economic data primarily from demographers at the state’s Department of Finance. Their annual accounting of people and residential properties, as of Jan. 1 each year, provides insight into population and housing supply swings within the Golden State.
Eyeballing what occurred between the start of this year and 2019, just before coronavirus upended the globe, gives us a snapshot of what’s working in this pandemic-twisted era. This is tricky, as the overarching pattern is an essentially flat statewide population — up 89,000 or 0.2% in seven years.
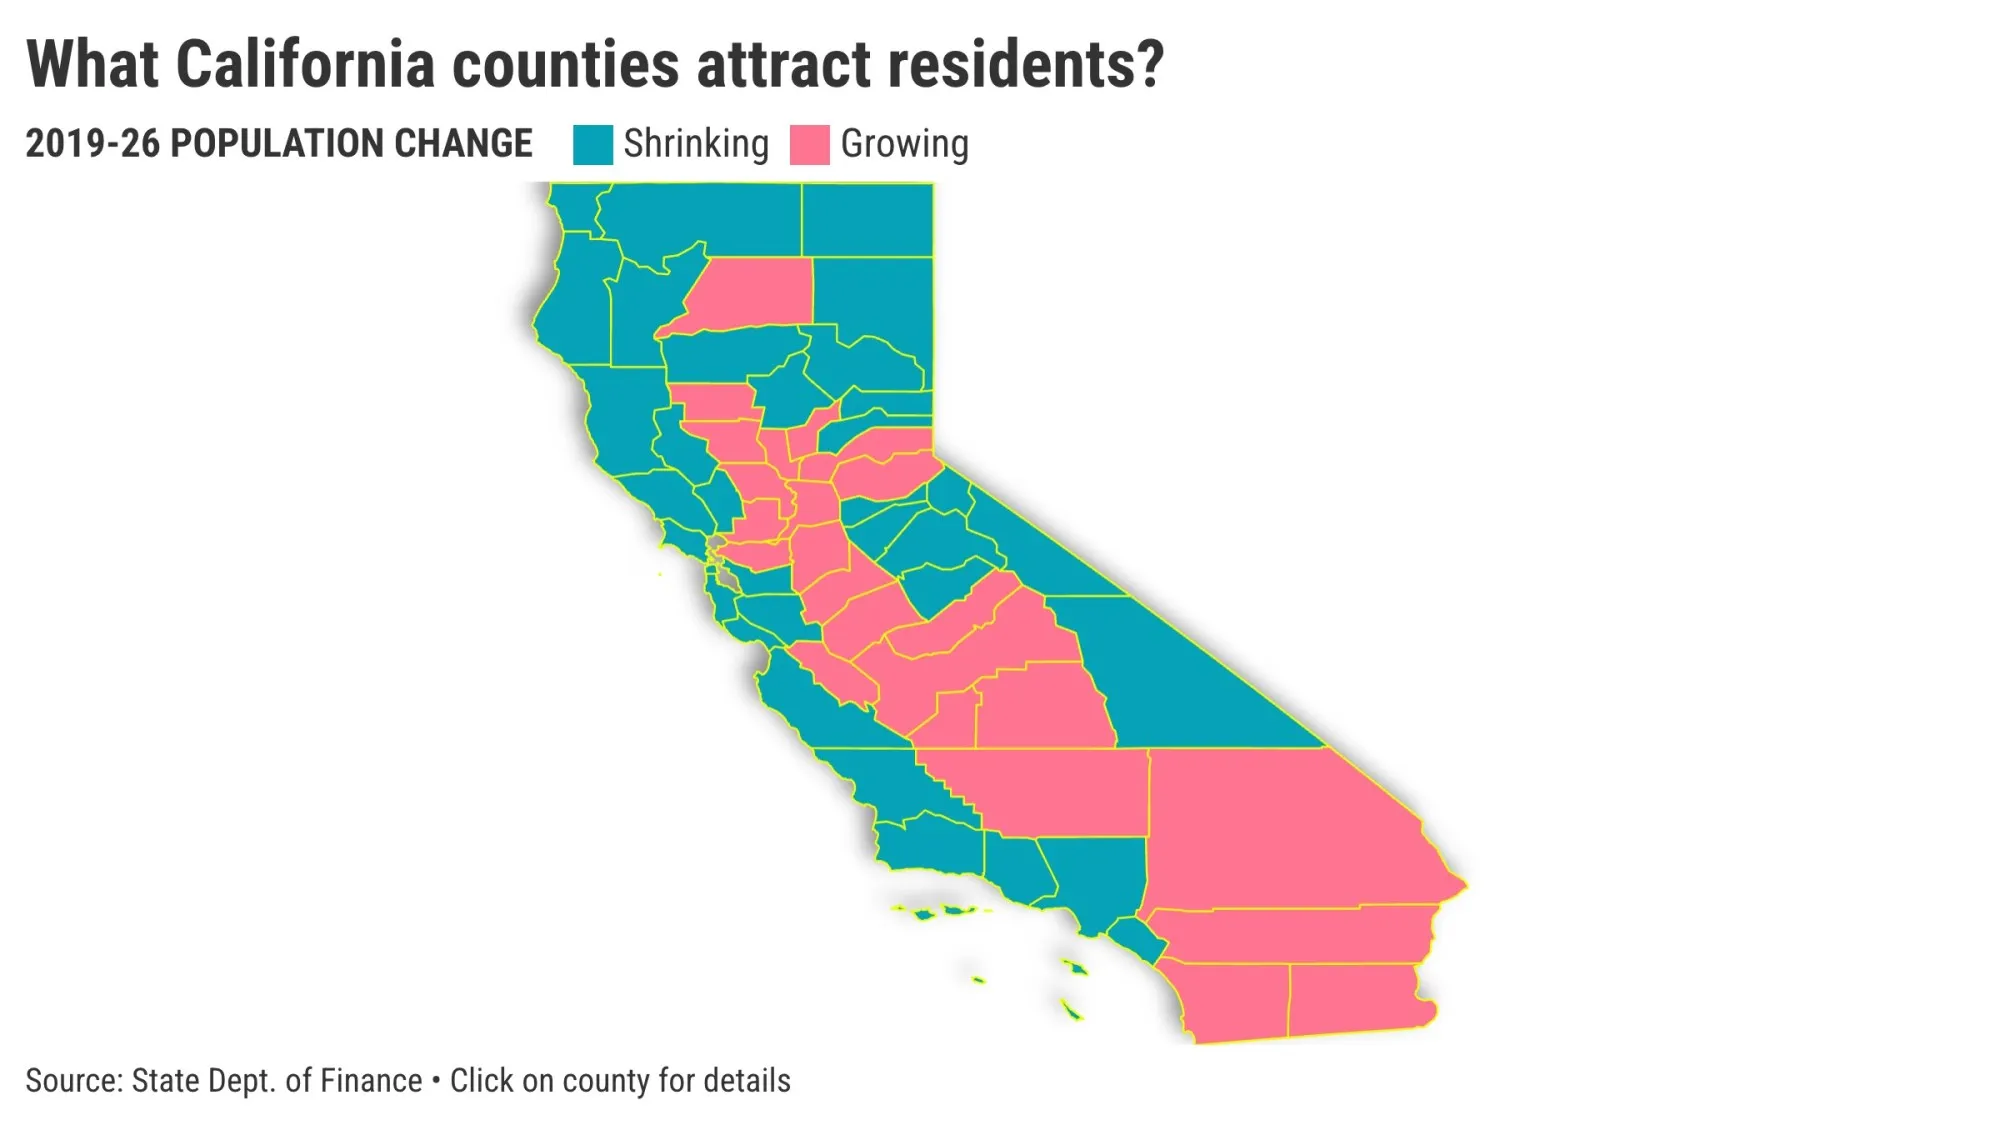
To find hints about what drives population attraction, we dug into the winners and losers: the state’s 58 counties split into two groups – those that added population over the past seven years vs. those that lost residents.
There’s certainly an attraction gap. In the 24 growth counties, population was up 3% to 17.3 million. In the 34 shrinking counties, population fell 2% to 22.3 million.
Attraction factor
“Build it, and they will come” sometimes works.
Population flows suggest people were drawn to areas where more housing was being created. During these seven years, the number of housing units grew by 7% where population rose, outpacing the 5% increase where population dropped.
Single-family residences were a key attraction factor.
- Also: SoCal’s $2 trillion economy is bigger than Florida’s
The 24 growing counties had a decidedly higher concentration of single-family residences: 72% of their housing units were single-family, compared with just 59% in 34 counties where population declined.
This suggests demand for family-friendly locales, a notion supported by a look at population density. This year, there were 2.74 residents per household in population gainers – slightly more crowded than the 2.55 ratio found where population dropped.
Build, baby, build
The growth spots also had more construction for these family-friendly residences.
Single-family creation rose 6% between 2019 and 2026 in California’s growth counties, outpacing a 3% increase where population dropped.
Additionally, growth counties doubled down on single-family housing, with 68% of their housing creation since 2019 in that style. It was just 36% in counties where population dropped.
Read more Wall Street rises as Amazon and chip stocks jump, even as oil prices add to worries about inflation
The price is wrong
Now, cogitate some affordability math that estimates housing costs for these two groups of counties using Census Bureau data tracking home values between 2019 and 2024.
- Also: Can LA-born Thrifty ice cream become a national brand?
Where the population grew, a typical home cost $586,500 vs. $949,500 where the population declined – a 62% gap.
Need I say more?
Jobs. Jobs. Jobs.
Let’s talk about another population magnet: Paychecks.
Looking at federal employment data, bosses in California’s growth counties grew staffing by 8% in seven years. Job growth was just 1% where population dropped.
Now, why were jobs added in those growth counties? It might be an odd measure of employer affordability.
- Follow local housing with our free “Home Stretch” email newsletter. SIGN UP HERE!
Where population grew, the average annualized wage was $74,000 last year vs. $116,000 where population declined – a 42% gap.
Bosses appear to be choosing lower-cost labor locations, or, as some California critics claim, much of the recent job creation has been in lower-wage industries.
Inland flavor
Ponder the 24 California counties with growing populations over the last seven years, ranked by the number of residents they added.
It’s another reminder of the inland theme to the state’s growth chart.
Nine of the top 10 are far from the coast: Riverside (up 112,700 residents), Sacramento (65,500), San Joaquin (52,800), San Bernardino (47,100), Fresno (41,000), Placer (35,200), Kern (28,700), Tulare (20,400), Merced (16,500).
San Diego, up 41,500, was the outlier.
And none of the other growth counties border the Pacific Ocean: Madera (10,800), Yolo (10,000), Yuba (8,100), Stanislaus (6,200), San Benito (5,400), Imperial (4,900), El Dorado (3,100), Contra Costa (2,800), Kings (1,800), Solano (1,500), Glenn (1,100), Shasta (400), Colusa (300) and Sutter (100).
Jonathan Lansner is the business columnist for the Southern California News Group. He can be reached at [email protected]
Read more Nearly half of those killed on roadways weren’t wearing seat belts